


Tracking your website’s performance isn’t easy. How do you know what’s working? Should that number be going up or down? What do all these jargon-y metrics actually mean?
This article is designed to help you understand 2 things:
- which metrics actually matter
- how those metrics affect your site and, therefore, your revenue.
It doesn’t matter if you’ve had your website for years or if you’re currently building a new one – this is the information you need to start properly tracking performance. Just as importantly, every metric I’ll mention can be tracked using free, industry-standard tools. You don’t need to pay for more subscriptions, no matter what your marketing agency tells you.
Enjoy – and, if you have questions, just email duncan@ionline.com.au and I’ll answer them (for free).
This article only covers metrics. Dimensions (descriptive ways to break down data), such as pages visited and search queries, are also useful, but in different ways.
Search Metrics
Search metrics can be found in search tracking tools like Google Search Console. They’re useful for understanding how your website performs in organic search (SEO).
Platforms: Google Search Console, Bing Webmaster Tools
Location: Varies
Description: Total clicks represents the total number of clicks your website has received from organic search over a given period.
GSC counts clicks from Google Search, Google Discover, and Google News. BWT counts clicks from anywhere in Bing. Note that, in GSC, a user clicking your site, clicking back to the search results, then clicking your site again only counts as one click.
Relevance: Total clicks is a key SEO metric – it’s the simplest, most accurate way to see how many users are clicking through to your site from the 2 most popular search engines.
Example:

Platforms: Google Search Console, Bing Webmaster Tools
Location: Varies
Definition: Impressions represents the total number of times your site has appeared in organic search results over a given period.
GSC counts impressions from Google Search, Google Discover, and Google News. BWT counts impressions from anywhere in Bing. Note that, in GSC, an impression occurs when a link to your site is loaded on the search engine results page (SERP) – it doesn’t mean the user has actually seen the link.
Relevance: Impressions can be used with other metrics to track your site’s performance. For example, rising impressions and rising clicks can mean your site is ranking well for a greater number of queries. Rising impressions and stable clicks can mean your site is ranking for more queries, but isn’t ranking well enough to drive traffic.
Example:

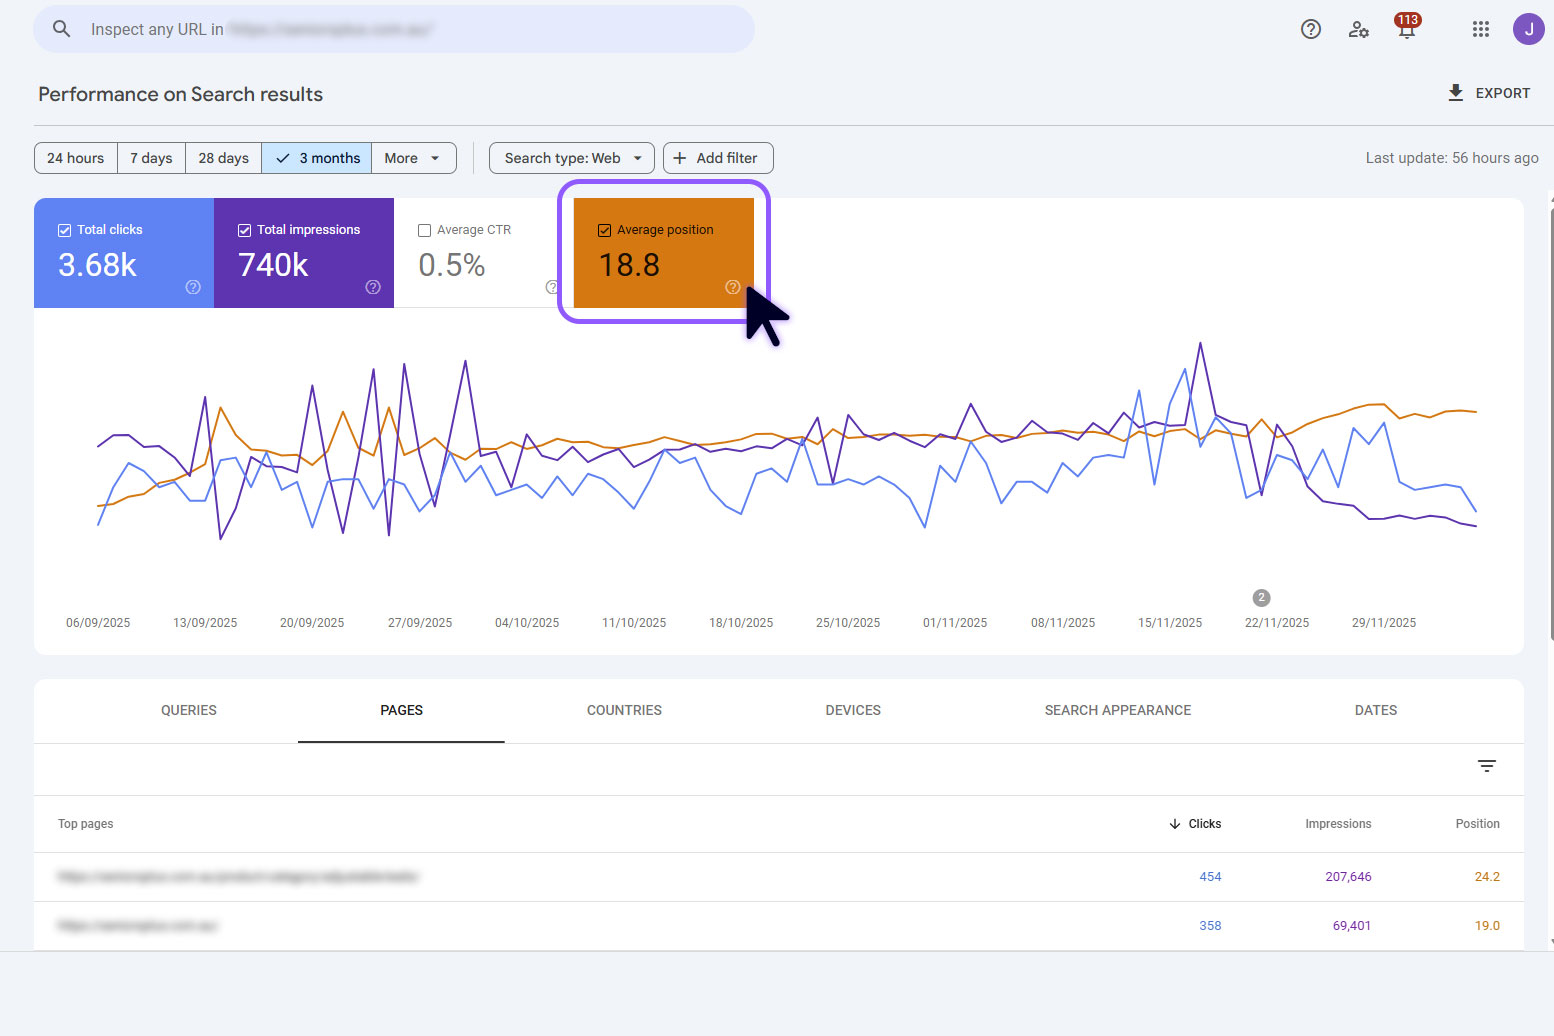
Platforms: Google Search Console
Location: Within a GSC account, go to: ‘Search Results’, then tick ‘Average position’
Definition: Average position is the top search position that a page or website attains when ranking for a specific query, averaged across all queries that page/site appears for.
For example, if iOnline’s Home page appears at positions 3, 6, and 9 for the query ‘digital marketing gold coast’, its position for that query would be 3. The average position for the iOnline Home page would be the sum of all positions for all queries, divided by the total number of queries.
Relevance: Average position shows how well, on average, a page or website ranks. A tightly focused page/site will have a higher average position than one with low-quality or unfocused content.
Example:
Engagement Metrics
Engagement metrics are found in website analytics and heat mapping tools. They’re useful for understanding how effective your website is at converting users to leads, sales or subscribers.
Platforms: Google Analytics
Location: Varies
Definition: Active users represents the total number of unique users who have an engaged session on your website in a given period. An engaged session is one that lasts 10 seconds or more, has one or more conversion events, or has 2 or more page views.
Relevance: Active users is the best way to understand how many people are spending time on your site. It filters out the ‘quick back’ visits – the users who click through, then immediately click away. It can also be used with the total users metric to understand how well your pages are matching user intent.
Example:

Platforms: Google Analytics
Location: Varies
Definition: Average engagement time represents the total length of time your website was in focus on a user’s device across all sessions divided by the total number of active users.
Relevance: Average engagement time can help you understand how well your website is meeting the intent of visitors. Different sites will have different engagement times – think about how long it will likely take a visitor to accomplish their tasks. Very short average engagement times (under 30 seconds) generally indicate poor content quality or poor intent matching.
Example:

Platforms: Microsoft Clarity
Location: Within a Clarity project, go to: ‘Dashboard’, then, under ‘Insights’, see ‘Dead clicks’
Definition: Dead clicks represent the total number of dead clicks within a given period. A dead click is when a user clicks somewhere on a website page without anything happening.
Relevance: Dead clicks are a good way to see how effective your UX and UI design is. A high percentage of dead clicks (upwards of ~5%) is an indication that users are getting confused or that something is broken. Remember: you’ll need to watch Clarity’s session recordings to pin down exactly what isn’t working.
Example:

Platforms: Google Analytics
Location: Varies
Definition: Key events represents the total number of key events that have occurred on your website over a given period. A key event is an event (an action that occurs on your website) that you have defined as important. Common examples of key events are phone number clicks, email clicks, and contact form submissions.
Relevance: Key events are your website’s most important leading indicator. A higher number of key events means more of the actions that lead to revenue are happening. Keep in mind that the usefulness of key events hinges on defining them properly. For most business sites, key events are the things that happen directly before the user becomes a lead or a sale – a phone number click, an online sale, a contact form submission, a Calendly meeting booked.
Example:

Platforms: Google Analytics
Location: Varies
Definition: New users represents the total number of users that have logged the first_visit event in a given period. (The first_visit event is triggered the first time a user visits a site with Google Analytics enabled.)
Relevance: New users is useful for gauging how many new people are visiting your website (versus repeat visitors). Unlike other some other website metrics, there’s no ideal ratio of new users to returning users. An e-commerce website, for example, might benefit from a lower percentage of new users than a professional services website – the former wants its customers to keep buying things through the site, while the latter only wants new leads (its existing clients have no need to return to the website).
Example:

Platforms: Microsoft Clarity
Location: Within a Clarity project, go to: ‘Dashboard’, then, under ‘Insights’, see ‘Quick backs’
Definition: Quick backs represent the total number of quick back-clicks within a given period. A quick back-click occurs when a user clicks through to a page on your website and then quickly clicks back to the previous page. (‘Quickly’ isn’t defined by Clarity, but is anchored by the average dwell time of the page in question – that is, how long users normally spend on that page before clicking back/forwards.)
Relevance: A high percentage of quick backs can indicate a few different problems. It can mean that the page you’ve linked to doesn’t meet user intent. It can also be a sign that users keep accidentally clicking on something (which is the result of poor UX/UI design) or that your page is slow to load, leading users to click upon the wrong element as the layout shifts.
Technical Metrics
Technical metrics are most useful for diagnosing problems that could be affecting search and engagement metrics.
Platforms: Lighthouse
Location: After running a PageSpeed Insights analysis: under ‘Metrics’, see ‘Largest Contentful Paint’
Definition: Largest contentful paint (LCP) is the total time required for a web page’s visually largest image, text block, or video to render. LCP excludes invisible elements, background images, and placeholder images – elements that aren’t considered ‘content’ for users.
Relevance: LCP is one of the best ways to measure page speed. It tracks when the biggest element on a page becomes visible to users – which is when they can really start engaging with the page. An LCP of more than 2.5 seconds is considered slow. Slow page loads can lead to frustrated users clicking away from your website and may affect your SEO.
Example:

Platforms: Lighthouse
Location: After running a PageSpeed Insights analysis: under ‘Metrics’, see ‘Largest Contentful Paint’
Definition: Total blocking time (TBT) is the total amount of time between first contentful paint (when the first content element on a web page is rendered) and time to interactive (when users can start engaging with the page).
Relevance: When your browser loads a web page, it’s asynchronous – all the different tasks that need to happen occur in order. They don’t take place at the same time. That means one slow task holds up the whole queue.
TBT helps identify why a page is running slowly. A high TBT (over 200 milliseconds) generally means that you have too much JavaScript being loaded on the page. That can be the result of a poorly built site, too many WordPress plugins, or unnecessary scripts that have been manually added to your site’s code.
Example:

Next Steps
So you read this article, checked your website’s metrics, and saw some numbers that raised your cortisol. What next?
Well, your first option is to talk to your current marketing agency. Optimising a given aspect of your website may not be within their scope – a web developer won’t be responsible for your SEO. The agency might also be focusing on other marketing channels; if you’re marketing mostly on socials, for example, your GSC metrics will look terrible, and that’s fine. Finally, the agency might be well aware of legacy problems and already have a plan in place to fix them.
But, if you need a second opinion, you’re more than welcome to reach out to us. We offer free, 30-minute strategy sessions for all new contacts – which involve us actually talking through problems with you (no sales pitches or slide decks unless you ask for them). We’ll explain whether a given metric matters and, if it does, help you work out a plan to fix it.
Interested? Book a time to chat.